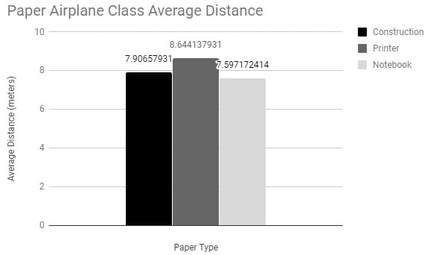
 In class today we wrote our conclusions for the paper airplane lab. We also added our class graph to our notebooks. These are the prompts for writing a complete conclusion:
0 Comments
Use the video below to help you make a line graph of your paper airplane data. You should graph all of your data points (do not graph the averages for this graph). Your graph should have three lines, one for each type of paper airplane. Make the X axis the "Trial Number" and the Y axis the distance. Congratulations on completing your NWEA test! With the time remaining in class you may pick from any of the following links/ activities. If you complete one or are would like to change activities, please choose a different activity to work on until the period is over.
Metric System Matching Game What did T. Rex taste like? Adventures at Dry Creek (Digital Fossil Hunting) Area Builder PhET Simulation Balloons and Static Electricity PhET Simulation Good luck to all students on their beginning of year NWEA test. We will take this test again at the end of the year to see how much science we've learned and how much we've improved.
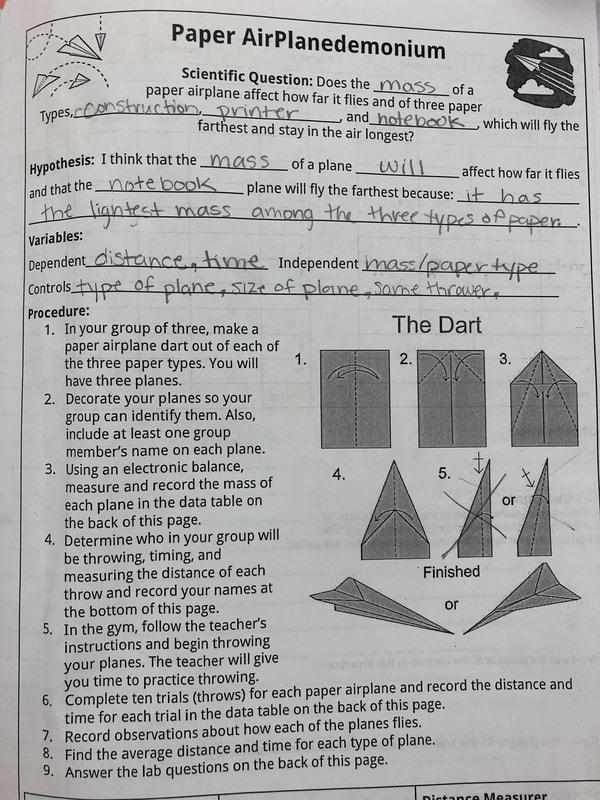
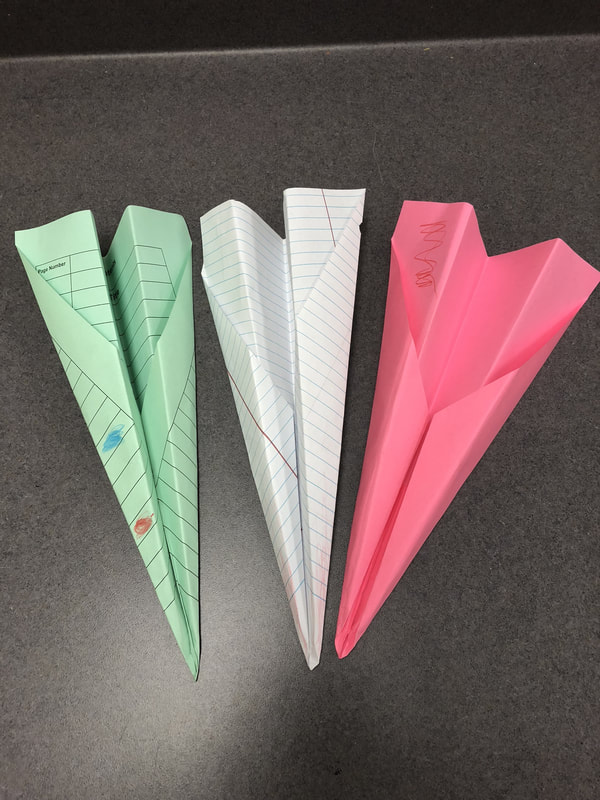
Today students began their first lab of the year. In this lab students make three different paper airplanes. Although the planes are the same size and style, they are made of three different materials; construction paper, printer paper, and notebook paper. The three different materials are all different masses which allows students to test the scientific question, "Does the mass of a paper airplane affect how far it flies?" Tomorrow we will test our planes and analyze our results. The lab sheet for this activity is attached below.
As we wrap up our beginning of the year introduction activities, the last question we pondered is "Why is science important?" After discussing our own thoughts, we watched a short clip of Dr. Neil deGrasse Tyson talking about why he thinks science is important then compared his ideas with our own. We ended class starting our first lab of the year Paper Airplanedemonium. Tomorrow we will continue our lab which we will finish on Friday.
Science is making a guess about the universe, testing (experimenting) that guess, then comparing the results of that test (experiment) with our original guess to see whether it holds true or not.
,In class today we drew what we think a scientist looks like. And although there were a lot of safety goggles, lab coats and bubbling beakers, there were also men and women of all shapes and sizes. Science is for everyone and anyone can be a scientist. Historically a field dominated by men, science is becoming more and more inclusive everyday and in fact kids are starting to catch on. According to this sciencemag.org article, children are now drawing scientists as women at a much higher rate than previous decades and this parallels an increase in women in the science field. Throughout this year we will study many different scientists, men and women, young and old, American, Mexican, European, Asian, African, Indegenous and more. Check out the video below about video game designer and computer scientist Lizette Titre-Montgomery as she explains how she went from being a cartoon animator to designer video games! |
AuthorMr. Powell is a High School Science Teacher in Western Colorado. Archives
May 2024
Categories
All
|
||||||||||||||||||

 RSS Feed